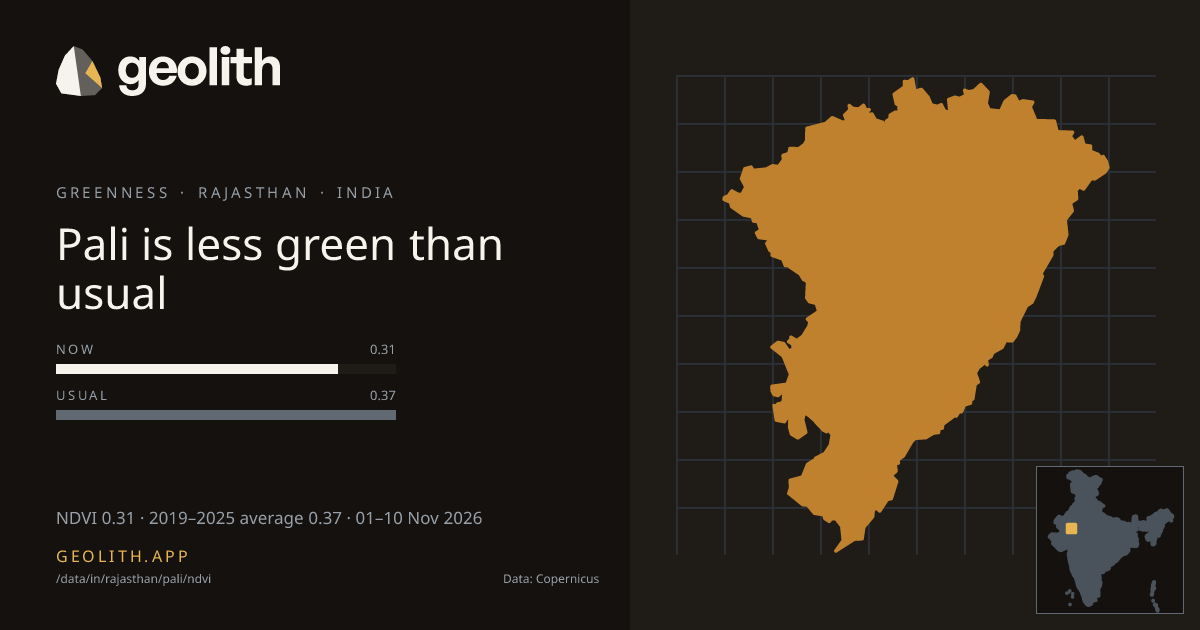
Pali is less green than usual
NDVI in Pali district: 10-day composite vs 2019–2025 average
NDVI 0.31 · 2019–2025 average 0.37 · 01–10 Nov 2026
Data updated 19 Nov 2026 · period 01–10 Nov 2026 · source CLMS NDVI 300 m v3
- Final
NDVI, 01–10 Nov 2026
0.31 NDVI
−0.06 vs 2019–2025 average (Sentinel-3 OLCI), average 0.37
- 2019–2025 average
- 0.37 (Sentinel-3 OLCI)
- Made from
- 10-day composite
- Rank in Rajasthan
- 24 of 41 greenest, tied with 1 more at 0.31
| Period ending | Value | Normal |
|---|---|---|
| 20 Jul 2026 | 0.22 | 0.28 |
| 31 Jul 2026 | 0.23 | 0.31 |
| 10 Aug 2026 | 0.28 | 0.33 |
| 20 Aug 2026 | 0.23 | 0.36 |
| 31 Aug 2026 | 0.30 | 0.41 |
| 10 Sep 2026 | 0.35 | 0.45 |
| 20 Sep 2026 | 0.41 | 0.50 |
| 30 Sep 2026 | 0.41 | 0.51 |
| 10 Oct 2026 | 0.35 | 0.47 |
| 20 Oct 2026 | 0.32 | 0.43 |
| 31 Oct 2026 | 0.31 | 0.40 |
| 10 Nov 2026 | 0.31 | 0.37 |
Dekad 01–10 Nov 2026
- <0.2< 0.2: 4 districts
- 0.20.2–0.3: 11 districts
- 0.30.3–0.4: 17 districts
- 0.40.4–0.5: 9 districts
- 0.50.5–0.6: 0 districts
- 0.60.6–0.7: 0 districts
- 0.70.7–0.8: 0 districts
- 0.80.8+: 0 districts
No district data
Pali, Rajasthan had an NDVI of 0.31 in the 10-day composite of 01–10 Nov 2026, −0.06 vs 2019–2025 average (Sentinel-3 OLCI), average 0.37. It ranks 24 of 41 districts in Rajasthan, greenest first, tied with 1 more at 0.31. The greenest dekad in the last 123 days ended 20 Sep 2026, at 0.41. 0 of 12 dekads with an average were above it.
Data files (CSV, Parquet, GeoParquet) and the Datasets API come with the Scale plan.
Contains modified Copernicus Land Monitoring Service information 2026
Boundaries: Overture Maps Foundation, © OpenStreetMap contributors, ODbL. India boundaries by DataMeet India community (CC BY 4.0)
Source: Local Government Directory, Government of India