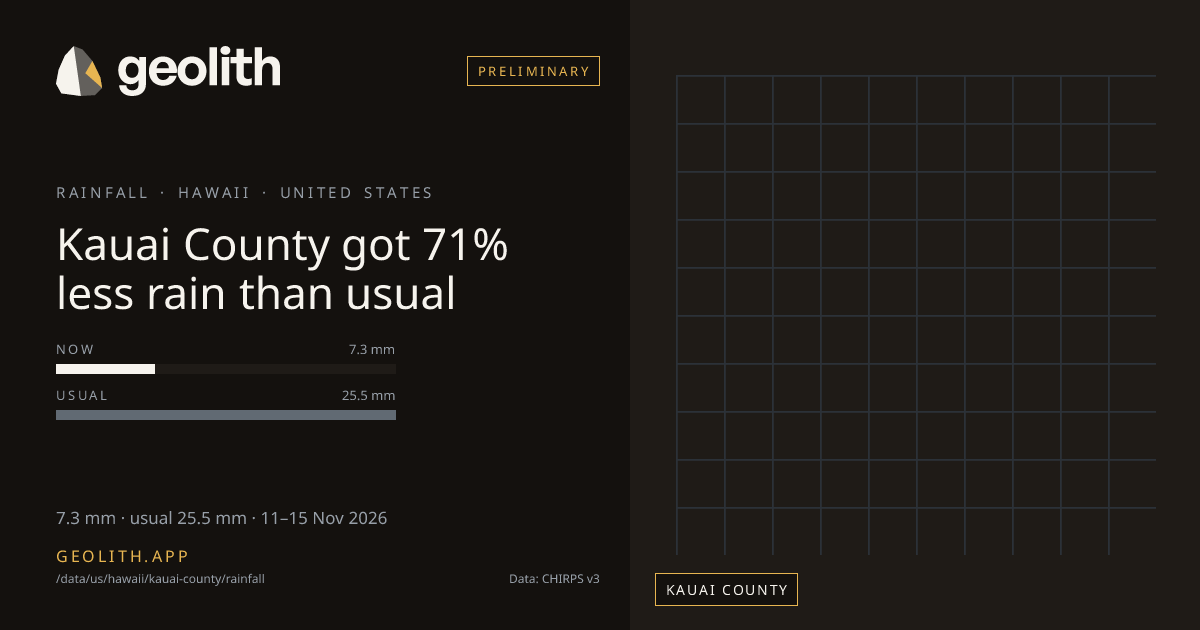
Kauai County got 71% less rain than usual
Rainfall in Kauai County: last 5 days vs normal
7.3 mm · 0.3 in · usual 25.5 mm · 11–15 Nov 2026
Data updated 20 Nov 2026 · period 11–15 Nov 2026 · source CHIRPS v3
- Preliminary
Rainfall, 11–15 Nov 2026
7.3 mm
71% below normal (25.5 mm)
- Normal
- 25.5 mm (1991–2020 mean)
- Rank in Hawaii
- 2 of 4 wettest
- Season to date
- 623 mm · +49%
| Period ending | Value | Normal |
|---|---|---|
| 20 Sep 2026 | 8.6 mm | 11.6 mm |
| 25 Sep 2026 | 5.0 mm | 10.5 mm |
| 30 Sep 2026 | 31.0 mm | 11.9 mm |
| 05 Oct 2026 | 38.8 mm | 18.6 mm |
| 10 Oct 2026 | 32.0 mm | 11.0 mm |
| 15 Oct 2026 | 8.1 mm | 16.5 mm |
| 20 Oct 2026 | 7.4 mm | 18.6 mm |
| 25 Oct 2026 | 7.3 mm | 12.3 mm |
| 31 Oct 2026 | 71.1 mm | 22.9 mm |
| 05 Nov 2026 | 34.4 mm | 24.1 mm |
| 10 Nov 2026 | 10.4 mm | 21.6 mm |
| 15 Nov 2026 | 7.3 mm | 25.5 mm |
Pentad 11–15 Nov 2026
- < 1< 1: 0 districts
- 1–51–5: 0 districts
- 5–105–10: 3 districts
- 10–2510–25: 1 districts
- 25–5025–50: 0 districts
- 50–10050–100: 0 districts
- 100–200100–200: 0 districts
- 200+200+: 0 districts
No district data
Kauai County, Hawaii received 7.3 mm of rainfall in the 5 days 11–15 Nov 2026, 71% below normal (25.5 mm). It ranks 2 of 4 counties in Hawaii, wettest first. Since 01 Jun 2026 it has received 623 mm, +49% vs the season normal. The wettest pentad in the last 61 days ended 31 Oct 2026, with 71.1 mm. 5 of 12 pentads with a normal were above it.
Data files (CSV, Parquet, GeoParquet) and the Datasets API come with the Scale plan.
Neighbouring districts
Neighbouring districts appear when the full build is published.
Embed this
<iframe src="https://geolith.app/embed/data/us/hawaii/kauai-county/rainfall" width="480" height="360" title="Rainfall in Kauai County" loading="lazy"></iframe>Share card
Rainfall: CHIRPS v3.0, Climate Hazards Center, UC Santa Barbara. CC BY 4.0. DOI 10.15780/G2JQ0P
Boundaries: Overture Maps Foundation, © OpenStreetMap contributors, ODbL. India boundaries by DataMeet India community (CC BY 4.0)