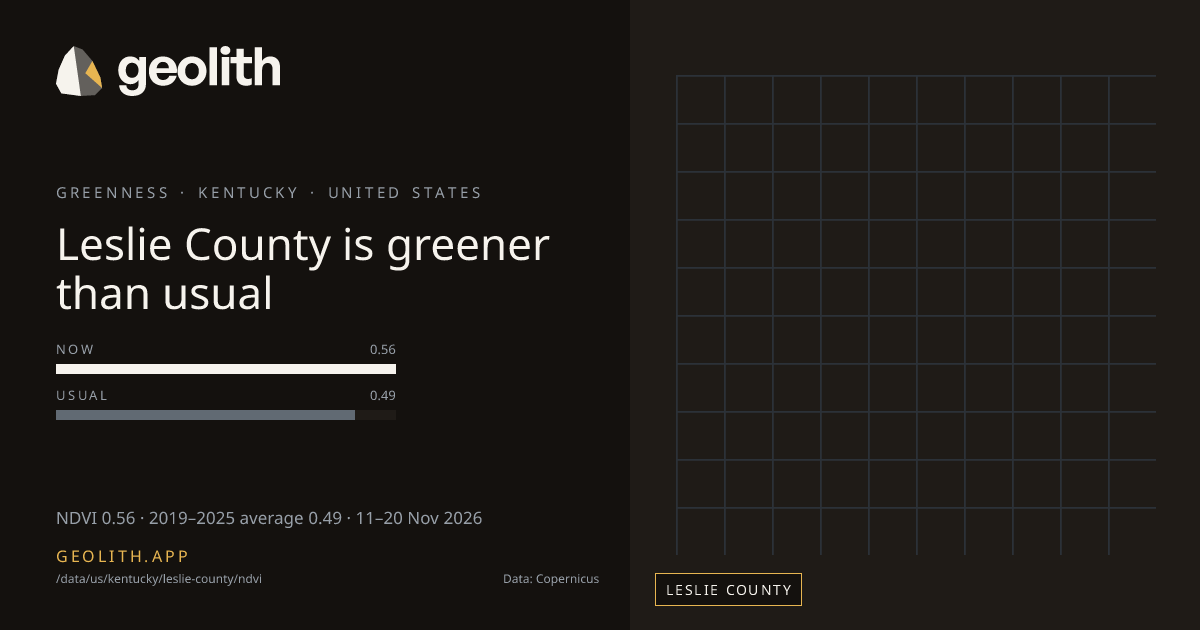
Leslie County is greener than usual
NDVI in Leslie County: 10-day composite vs 2019–2025 average
NDVI 0.56 · 2019–2025 average 0.49 · 11–20 Nov 2026
Data updated 22 Nov 2026 · period 11–20 Nov 2026 · source CLMS NDVI 300 m v3
- Final
NDVI, 11–20 Nov 2026
0.56 NDVI
+0.07 vs 2019–2025 average (Sentinel-3 OLCI), average 0.49
- 2019–2025 average
- 0.49 (Sentinel-3 OLCI)
- Made from
- 10-day composite
- Rank in Kentucky
- 50 of 120 greenest, tied with 16 more at 0.56
| Period ending | Value | Normal |
|---|---|---|
| 31 Jul 2026 | 0.86 | 0.84 |
| 10 Aug 2026 | 0.86 | 0.83 |
| 20 Aug 2026 | 0.85 | 0.85 |
| 31 Aug 2026 | 0.83 | 0.86 |
| 10 Sep 2026 | 0.87 | 0.85 |
| 20 Sep 2026 | 0.82 | 0.85 |
| 30 Sep 2026 | 0.82 | 0.84 |
| 10 Oct 2026 | 0.84 | 0.83 |
| 20 Oct 2026 | 0.73 | 0.79 |
| 31 Oct 2026 | 0.80 | 0.72 |
| 10 Nov 2026 | 0.59 | 0.58 |
| 20 Nov 2026 | 0.56 | 0.49 |
Dekad 11–20 Nov 2026
- <0.2< 0.2: 0 districts
- 0.20.2–0.3: 0 districts
- 0.30.3–0.4: 0 districts
- 0.40.4–0.5: 11 districts
- 0.50.5–0.6: 103 districts
- 0.60.6–0.7: 6 districts
- 0.70.7–0.8: 0 districts
- 0.80.8+: 0 districts
No district data
Leslie County, Kentucky had an NDVI of 0.56 in the 10-day composite of 11–20 Nov 2026, +0.07 vs 2019–2025 average (Sentinel-3 OLCI), average 0.49. It ranks 50 of 120 counties in Kentucky, greenest first, tied with 16 more at 0.56. The greenest dekad in the last 123 days ended 10 Sep 2026, at 0.87. 8 of 12 dekads with an average were above it.
Data files (CSV, Parquet, GeoParquet) and the Datasets API come with the Scale plan.
Neighbouring districts
- Perry County+0.06
- Harlan County+0.07
- Clay County+0.06
- Bell County+0.07
Embed this
<iframe src="https://geolith.app/embed/data/us/kentucky/leslie-county/ndvi" width="480" height="360" title="NDVI in Leslie County" loading="lazy"></iframe>Share card
Contains modified Copernicus Land Monitoring Service information 2026
Boundaries: Overture Maps Foundation, © OpenStreetMap contributors, ODbL. India boundaries by DataMeet India community (CC BY 4.0)