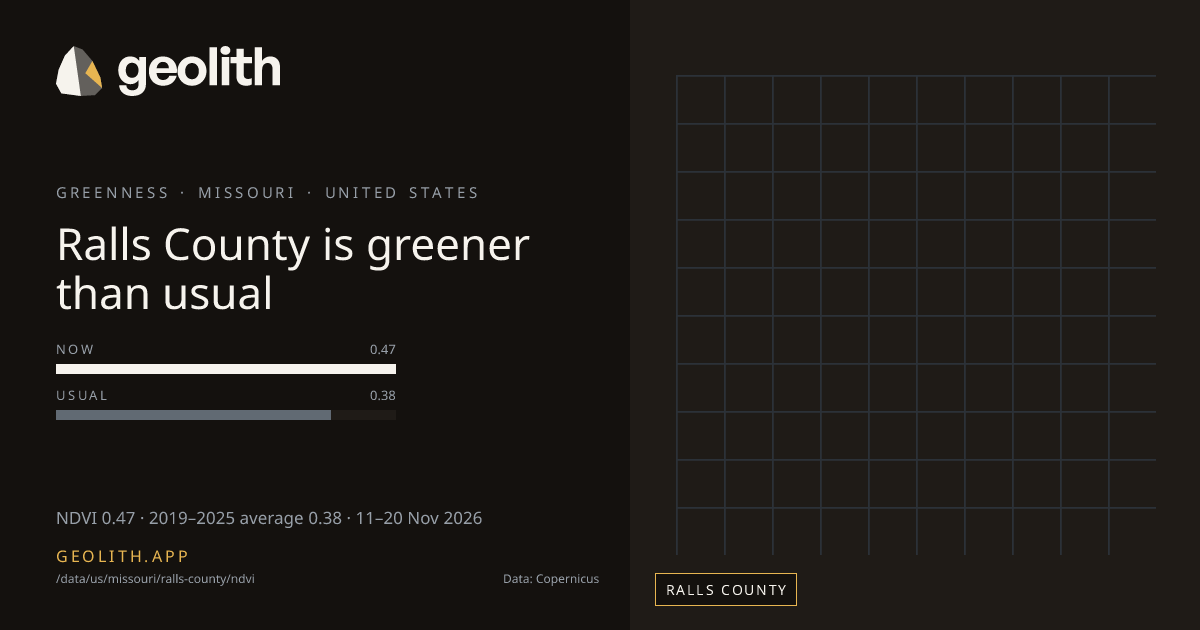
Ralls County is greener than usual
NDVI in Ralls County: 10-day composite vs 2019–2025 average
NDVI 0.47 · 2019–2025 average 0.38 · 11–20 Nov 2026
Data updated 22 Nov 2026 · period 11–20 Nov 2026 · source CLMS NDVI 300 m v3
- Final
NDVI, 11–20 Nov 2026
0.47 NDVI
+0.09 vs 2019–2025 average (Sentinel-3 OLCI), average 0.38
- 2019–2025 average
- 0.38 (Sentinel-3 OLCI)
- Made from
- 10-day composite
- Rank in Missouri
- 100 of 115 greenest
| Period ending | Value | Normal |
|---|---|---|
| 31 Jul 2026 | 0.79 | 0.74 |
| 10 Aug 2026 | 0.75 | 0.76 |
| 20 Aug 2026 | 0.77 | 0.79 |
| 31 Aug 2026 | 0.78 | 0.80 |
| 10 Sep 2026 | 0.70 | 0.78 |
| 20 Sep 2026 | 0.61 | 0.74 |
| 30 Sep 2026 | 0.59 | 0.66 |
| 10 Oct 2026 | 0.53 | 0.59 |
| 20 Oct 2026 | 0.49 | 0.53 |
| 31 Oct 2026 | 0.50 | 0.48 |
| 10 Nov 2026 | 0.43 | 0.44 |
| 20 Nov 2026 | 0.47 | 0.38 |
Dekad 11–20 Nov 2026
- <0.2< 0.2: 0 districts
- 0.20.2–0.3: 0 districts
- 0.30.3–0.4: 8 districts
- 0.40.4–0.5: 17 districts
- 0.50.5–0.6: 75 districts
- 0.60.6–0.7: 16 districts
- 0.70.7–0.8: 0 districts
- 0.80.8+: 0 districts
No district data
Ralls County, Missouri had an NDVI of 0.47 in the 10-day composite of 11–20 Nov 2026, +0.09 vs 2019–2025 average (Sentinel-3 OLCI), average 0.38. It ranks 100 of 115 counties in Missouri, greenest first. The greenest dekad in the last 123 days ended 31 Jul 2026, at 0.79. 3 of 12 dekads with an average were above it.
Data files (CSV, Parquet, GeoParquet) and the Datasets API come with the Scale plan.
Neighbouring districts
- Marion County+0.14
- Pike County+0.09
- Audrain County+0.08
- Monroe County+0.11
- Pike County+0.09
Embed this
<iframe src="https://geolith.app/embed/data/us/missouri/ralls-county/ndvi" width="480" height="360" title="NDVI in Ralls County" loading="lazy"></iframe>Share card
Contains modified Copernicus Land Monitoring Service information 2026
Boundaries: Overture Maps Foundation, © OpenStreetMap contributors, ODbL. India boundaries by DataMeet India community (CC BY 4.0)