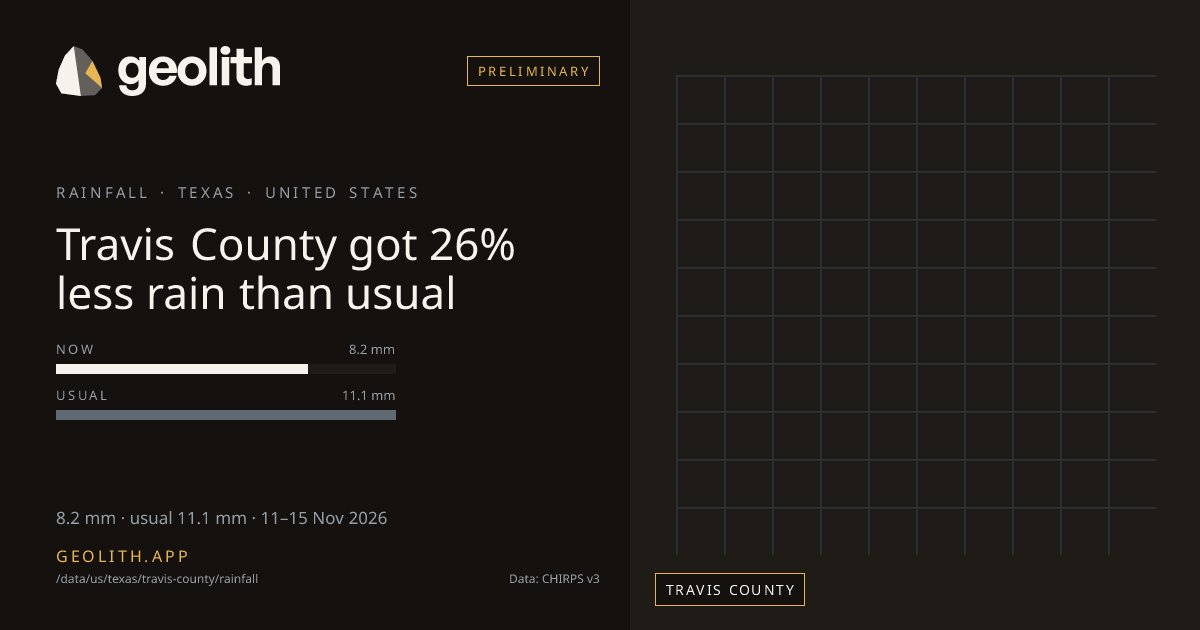
Travis County got 26% less rain than usual
Rainfall in Travis County: last 5 days vs normal
8.2 mm · 0.3 in · usual 11.1 mm · 11–15 Nov 2026
Data updated 20 Nov 2026 · period 11–15 Nov 2026 · source CHIRPS v3
- Preliminary
Rainfall, 11–15 Nov 2026
8.2 mm
26% below normal (11.1 mm)
- Normal
- 11.1 mm (1991–2020 mean)
- Rank in Texas
- 129 of 254 wettest
- Season to date
- 402 mm · −14%
| Period ending | Value | Normal |
|---|---|---|
| 20 Sep 2026 | 4.3 mm | 15.3 mm |
| 25 Sep 2026 | 10.8 mm | 17.3 mm |
| 30 Sep 2026 | 8.8 mm | 11.7 mm |
| 05 Oct 2026 | 57.5 mm | 7.7 mm |
| 10 Oct 2026 | 2.4 mm | 23.8 mm |
| 15 Oct 2026 | 4.3 mm | 17.6 mm |
| 20 Oct 2026 | 2.1 mm | 20.9 mm |
| 25 Oct 2026 | 2.8 mm | 23.8 mm |
| 31 Oct 2026 | 13.8 mm | 21.8 mm |
| 05 Nov 2026 | 26.3 mm | 16.5 mm |
| 10 Nov 2026 | 16.7 mm | 9.2 mm |
| 15 Nov 2026 | 8.2 mm | 11.1 mm |
Pentad 11–15 Nov 2026
- < 1< 1: 33 districts
- 1–51–5: 60 districts
- 5–105–10: 45 districts
- 10–2510–25: 99 districts
- 25–5025–50: 14 districts
- 50–10050–100: 3 districts
- 100–200100–200: 0 districts
- 200+200+: 0 districts
No district data
Travis County, Texas received 8.2 mm of rainfall in the 5 days 11–15 Nov 2026, 26% below normal (11.1 mm). It ranks 129 of 254 counties in Texas, wettest first. Since 01 Jun 2026 it has received 402 mm, −14% vs the season normal. The wettest pentad in the last 61 days ended 05 Oct 2026, with 57.5 mm. 3 of 12 pentads with a normal were above it.
Data files (CSV, Parquet, GeoParquet) and the Datasets API come with the Scale plan.
Neighbouring districts
- Williamson County+9%
- Hays County−25%
- Caldwell County−26%
- Bastrop County−34%
- Burnet County−22%
- Blanco County−40%
Embed this
<iframe src="https://geolith.app/embed/data/us/texas/travis-county/rainfall" width="480" height="360" title="Rainfall in Travis County" loading="lazy"></iframe>Share card
Rainfall: CHIRPS v3.0, Climate Hazards Center, UC Santa Barbara. CC BY 4.0. DOI 10.15780/G2JQ0P
Boundaries: Overture Maps Foundation, © OpenStreetMap contributors, ODbL. India boundaries by DataMeet India community (CC BY 4.0)